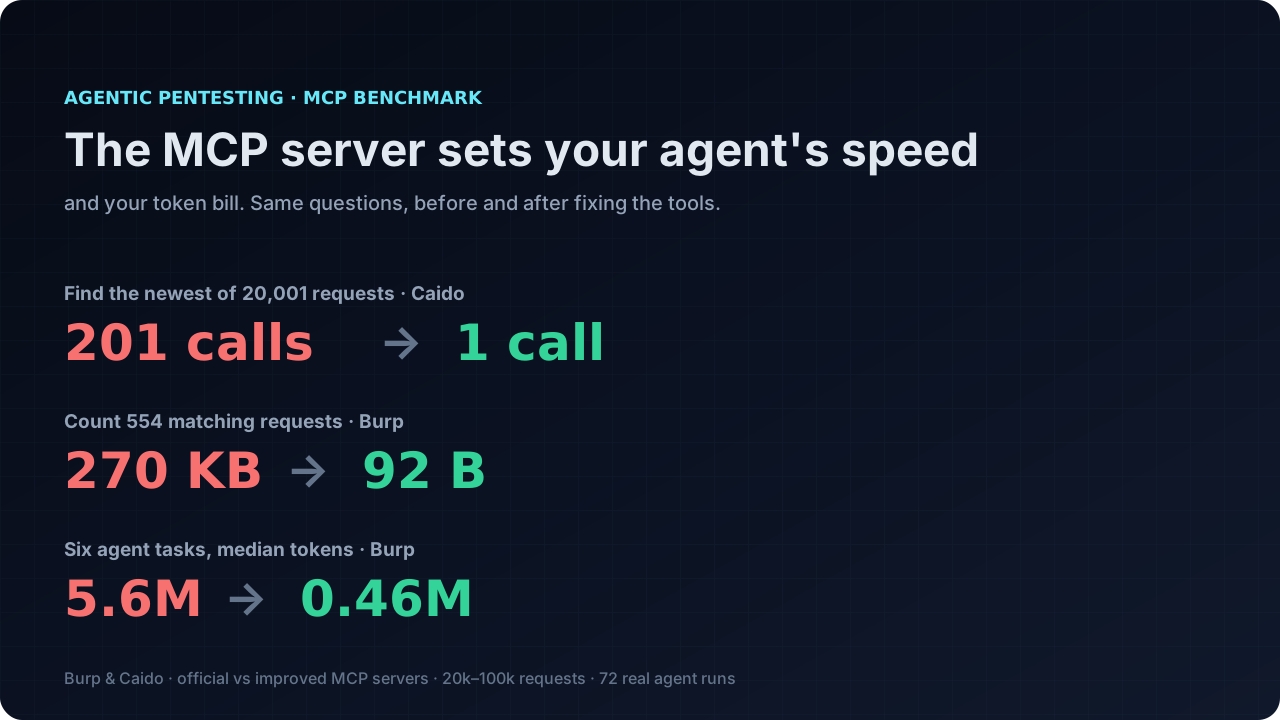
I benchmarked Burp & Caido MCP. They were slowing my agent down so I made them 3x faster & 6x cheaper.
Four MCP servers, a 20,000 to 100,000 request proxy history, 14 scripted tasks and 72 real agent runs. The fixed servers answered every question, 6x cheaper and 3x faster, with 137x less tool output.
On this page
After using Burp & Caido MCP extensively to assist me during bug bounties I realized the tools were sometimes slowing me down. I decided to dig into the MCP code to understand why. This resulted in me creating a benchmark for HTTP proxy and improving the existing Burp & Caido MCP servers to make them much more efficient.
It all started when I asked my agent to modify the very last request from a large proxy history. At the time I was using the official Burp & Caido MCP. I realized both of them didn’t have the ability to just fetch the last request. Instead, they would fetch the entire history and paginate… 200+ calls, 2 MB output, countless token and several minutes for something that should be instant and cheap.
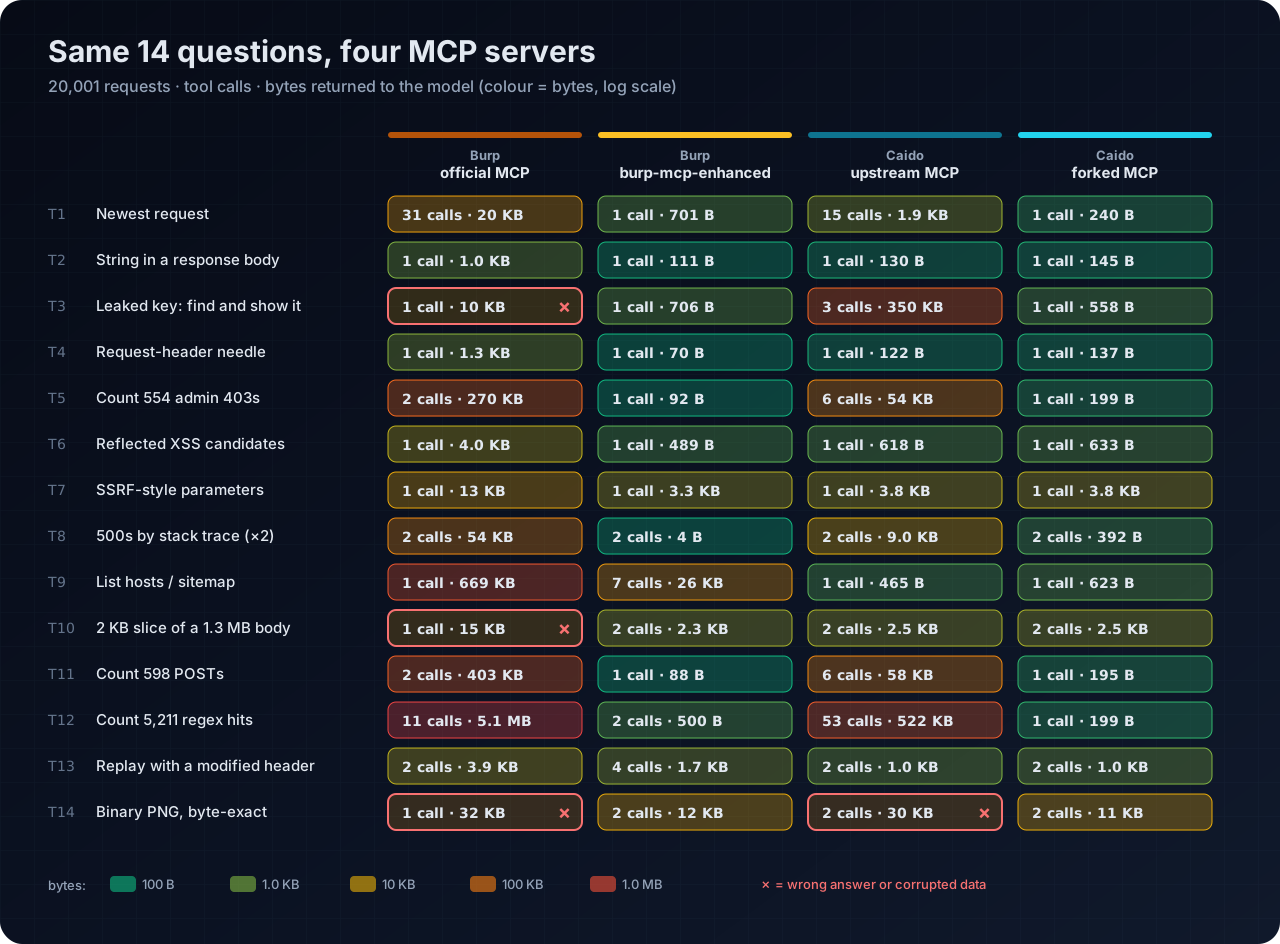
The table below shows the result of my benchmark for both official MCP & my forked versions.
The Four Horseman
| Label | What it is | Version |
|---|---|---|
| Burp, official | PortSwigger/mcp-server, the extension in the BApp store | 1.3.0, built from the tag |
| Burp, enhanced | burp-mcp-enhanced, my fork of the official extension | 1.3.0-enhanced.2 |
| Caido, upstream | c0tton-fluff/caido-mcp-server, the server Caido’s MCP tutorial points to | v4.4.0 |
| Caido, forked | my fork with the changes described below | v4.4.0 plus the merged and open PRs listed below |
Caido does not ship a first-party MCP server. The community server is the one its documentation recommends, so I treat it as the upstream baseline.
How I benchmarked
The corpus. I wrote a deterministic generator (fixed seed) that sends 20,000 requests through the proxy to a local target with six virtual hosts: a shop, a JSON API, an admin panel, a static asset host, an auth service and a GraphQL endpoint. A last marker request, GET /api/v1/health?final=1, follows once every worker has finished, so the newest request is always known. The traffic has the shape of a real engagement:
- HTML pages, JSON APIs, 150 KB JavaScript bundles, PNG images and three 1.3 MB JSON responses;
- 401, 403 and 500 responses, with Python tracebacks and Java stack traces.
I planted some values at known positions, so I could check every answer exactly:
- a flag in one user record;
- an AWS-style access key in the middle of a 150 KB bundle;
- five reflected
<svg/onload=...>payloads; - one unique request header;
- 25 parameters that carry URLs.
Isolation. I used a fresh project for every run, with nothing else in the history.
- Caido: separate
caido-cliinstances with empty projects. - Burp: a copied home directory under a virtual X display. I loaded one MCP extension at a time and confirmed which one through its
serverInfo.
Layer 1: a scripted client. I wrote a small MCP client (stdio for Caido, SSE for Burp) that runs 14 tasks against each server, using the best strategy that server’s tools allow. For each task I recorded:
- the number of tool calls;
- the bytes of tool output returned to the model (divide by about four for tokens);
- wall time;
- whether the answer matched ground truth.
If a server has no count tool, the strategy pages through every match and counts them. If it cannot sort, the strategy uses the cleverest workaround I found, such as bisecting on row IDs.
Layer 2: a scale sweep. I loaded the same corpus five times, up to 100,005 requests. After each load I measured four tasks and the proxy’s memory. The Burp fork’s sweep ran on 1.3.0-enhanced.1; its four tasks don’t use the search tool that 1.3.0-enhanced.2 adds.
Layer 3: real agents. I ran Claude Code headless with Sonnet and limited each session to the MCP server under test: no shell, no file access, no web.
- Six plain-language questions, three runs each per server, 72 runs in total.
- The same system prompt every time, and a $3 budget cap per run.
- I recorded wall time, tool calls, tool output, tokens (including cache reads) and the API-equivalent cost Claude Code reports.
- I checked every answer against ground truth with fixed patterns.
- The replay task creates traffic, so it always ran last. For the final Caido numbers, I started every replay run, on both servers, from the same snapshot: the 20k corpus plus four earlier Replay entries of the target request, sent without the
Authorizationheader.
The limits are worth stating. Everything ran on loopback, so network latency is absent. The corpus is synthetic. I used one model, and three runs per task show variance but are not a statistical study. On Burp, I pre-approved history access and the six test hosts so that approval dialogs could not block the agents.
Where the official servers fall short
Burp, official
PortSwigger’s server has 27 tools. Its history tools return items in capture order, page by count and offset, and truncate each item at 5,000 characters. Here is what that cost at 20,001 requests:
- No newest-first. Finding the last request took 31 offset probes. In one of three agent runs, the agent reported the oldest request (
POST /loginon the auth host) as the newest, because it never reached the end of the history. - No count. Counting 554 admin 403s meant paging every match: 270 KB of output. Counting 5,211 regex hits took 11 pages and 5.1 MB.
- A hard 5,000-character cap. The regex search found the JavaScript file with the AWS key, but the key sits about 80 KB into the body, so the truncated item never showed it. The cap is a plain
substring(0, 5000), which also breaks the JSON of long items. - No byte slicing and no binary path. Reading 2 KB from the middle of a 1.3 MB response was impossible, and a PNG could not be retrieved intact.
- No sitemap. Listing the hosts meant pulling a 669 KB page of history.
It also reports its version as 1.1.2 in serverInfo, although the build is 1.3.0.
Caido, upstream
The Caido server has 70 tools and wraps Caido’s GraphQL API. HTTPQL filtering runs on the server, so needle searches were already cheap: one call and a few hundred bytes. The problems were elsewhere:
- No sort order.
caido_list_requestssent onlyfirst,afterandfilter, so every page started at the oldest request. The newest request cost 201 calls and 2.0 MB by paging, or 15 calls with a row-ID bisection trick that nothing in the tool description suggests. One agent run got there by decoding the base64 pagination cursor and forging a new one with a higher ID. That worked, but it isn’t something you want an agent to depend on. - No total. Caido’s API already returns a
countwith each query; the tool discarded it. Counting 5,211 matches took 53 calls and 522 KB. Asked for requests per host, the agent gave up on all three runs and said the tools had “no count or aggregate function”. - Lossy binary bodies. Bodies were converted to strings, so a PNG came back with 3,470 replacement characters.
- No way to see a match without the whole body. Showing the leaked key meant pulling two 160 KB bundles, 350 KB in total.
What I changed
The Burp MCP fork
My fork adds the primitives the official server lacks:
- a newest-first view;
- a regex count that runs inside Burp;
- a structured filter with real totals and offsets;
- byte-range reads of any message;
- replay from history with mutations and a response diff;
- a regex search that returns each match with its offset and the surrounding text (
search_proxy_http_history); see one more iteration.
Its first version carried its own bugs, which I found while preparing this benchmark:
- Regex results reported positions inside the filtered list, so “find, then read” opened the wrong request.
- Adding a header during replay was silently dropped.
- Replay skipped the per-host approval that a normal send goes through.
I merged the current version onto upstream 1.3.0 and fixed all three. It also:
- adds ids, timestamps and MIME types to every item;
- caps output sizes with explicit errors;
- keeps truncated items valid JSON;
- reports the correct version.
The Caido MCP fork
My fork adds the primitives the upstream server lacks:
- Ordering and totals.
caido_list_requestsgainsorderByandorder, and the response carriestotalCount. The newest request is{"limit": 1, "order": "desc"}. A count is{"httpql": "...", "limit": 1}. Calls without the new parameters send the same query as before. - Binary-safe bodies.
caido_get_requestreturns base64 withbodyEncodingandbodySizewhen a body is not valid UTF-8. Text bodies are byte-identical to before. - Match snippets and extra fields. A
snippetoption runs an RE2 regex over the returned rows and reports each match with its byte offset and some context.fieldsaddscreatedAt,responseLengthand similar fields to each row on request. Rows that did not come through the proxy carry theirsource, such asREPLAY, without being asked; the replay task shows why. - Host counts in the sitemap. The root entries now carry the exact number of captured requests for each host.
Caido merged the ordering and totals change (PR #73) upstream. The binary-safe bodies (PR #82), match snippets (PR #84) and sitemap host counts (PR #81) are open pull requests as I write this. Two further pull requests, WebSocket stream paging and plugin backend calls, are open as well, but they fall outside what this post measures.
Results at 20,001 requests
Summed over the 14 tasks of layer 1:
| Server | Correct | Tool calls | Output to the model |
|---|---|---|---|
| Burp, official | 11 / 14 | 58 | 6.6 MB |
| Burp, enhanced | 14 / 14 | 27 | 48.1 KB |
| Caido, upstream | 13 / 14 | 96 | 1.0 MB |
| Caido, forked | 14 / 14 | 18 | 21.7 KB |
The Caido upstream total uses the row-ID bisection for the newest request. With plain paging, that one task adds 201 calls and 2 MB on its own.
The per-task grid at the top of this post shows where the bytes go. Counting is the worst category for both official servers, because “how many” turns into “send me all of them”.
Growth with history size
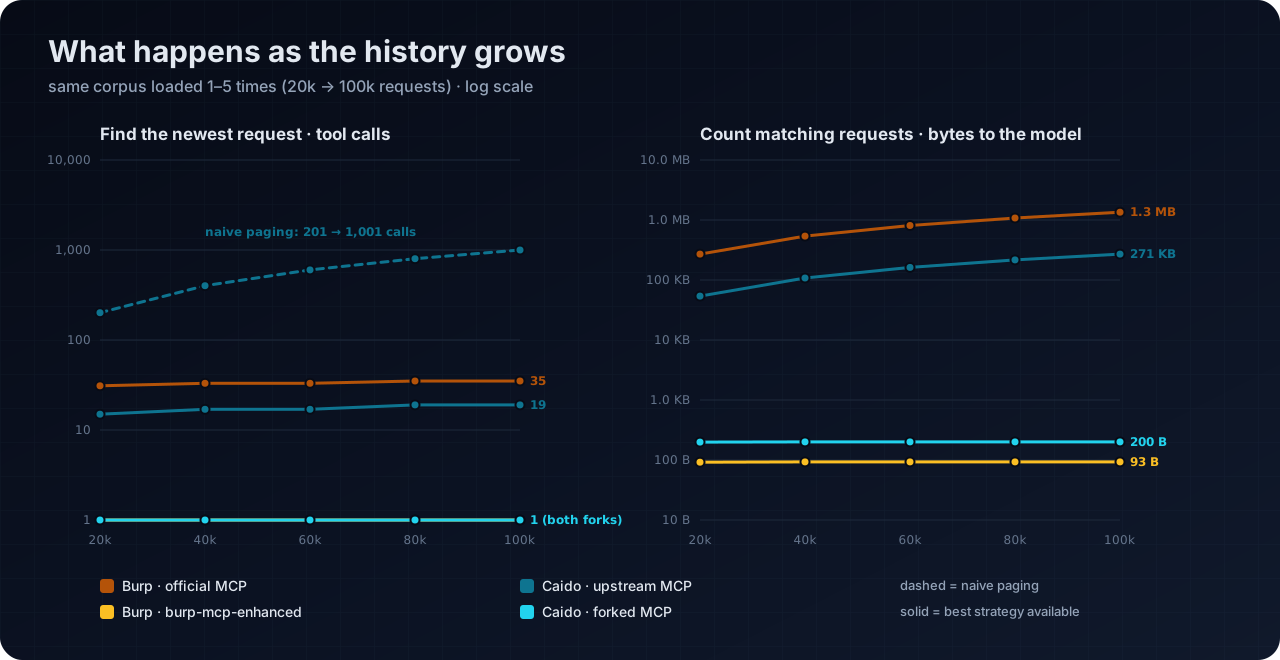
Without a server-side primitive, cost grows with the history:
- On the Caido upstream server, paging to the newest request went from 201 calls at 20k to 1,001 calls (10 MB) at 100k.
- Burp’s offset probing stayed around 31 to 35 calls, but its wall time rose from 3.9 s to 21.7 s, because each probe makes Burp rebuild the history list up to that offset.
- Counting admin 403s grew from 270 KB to 1.35 MB on Burp official, and from 54 KB to 271 KB on Caido upstream.
Both forks stayed flat: one call and under 1 KB at every size, for the newest request and for counts.
Real agents
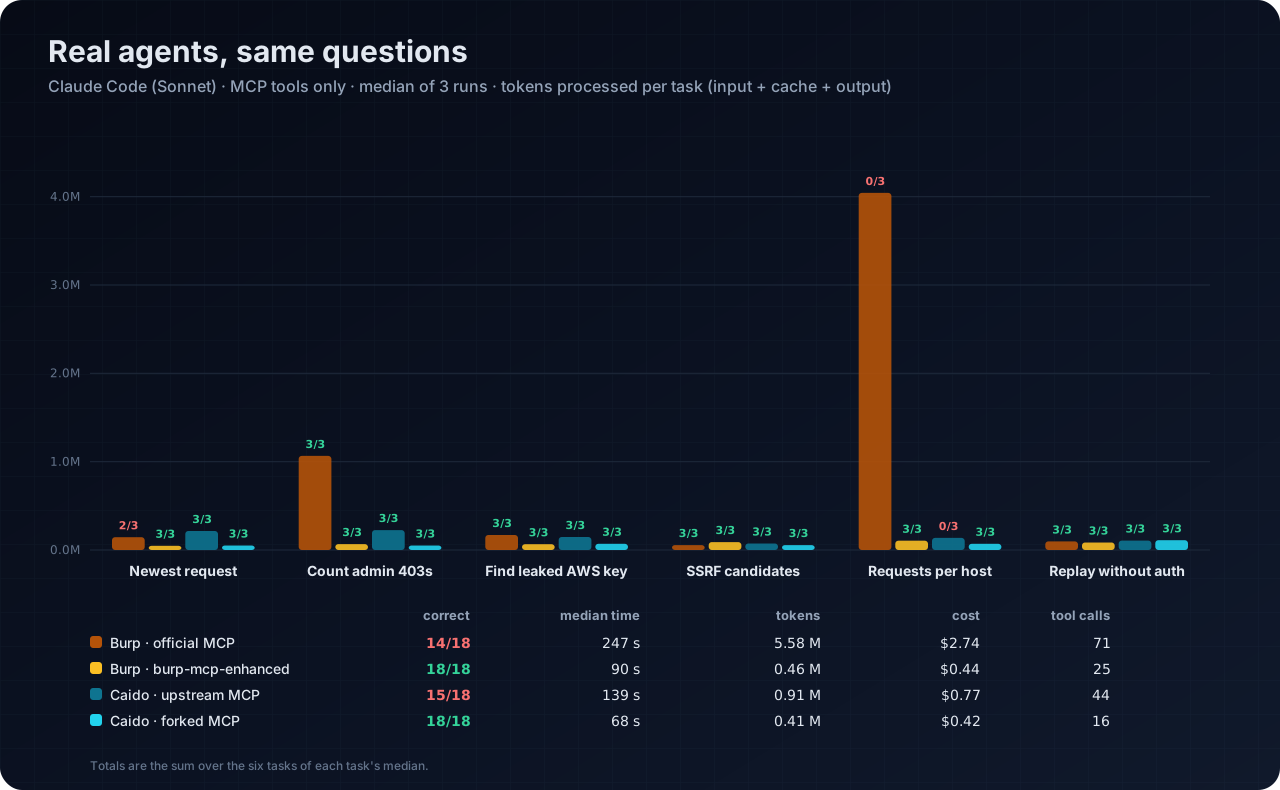
The scripted client shows the best case. Agents show what happens in practice. The totals below add up each task’s median over three runs:
| Server | Correct runs | Time | Tokens | Cost |
|---|---|---|---|---|
| Burp, official | 14 / 18 | 247 s | 5.58 M | $2.74 |
| Burp, enhanced | 18 / 18 | 90 s | 0.46 M | $0.44 |
| Caido, upstream | 15 / 18 | 139 s | 0.91 M | $0.77 |
| Caido, forked | 18 / 18 | 68 s | 0.41 M | $0.42 |
All 18 runs per server cost $8.48 on Burp official versus $1.42 on the enhanced fork, and $3.92 on Caido upstream versus $1.34 on the Caido fork.
The averages hide where the MCP server actually slows the agent down:
- Counting on Burp official. For “how many requests to the admin host got a 403”, the median run took 69.5 s, 20 tool calls and 1.07 M tokens. With the enhanced fork it took 10.8 s, 2 calls and 67 K tokens. Same answer.
- Requests per host. Burp official failed all three runs: median 92.5 s and $1.73 per run. The worst run made 54 calls before it reported that it had run out of budget. Caido upstream also failed all three, at a lower cost (median 26.5 s and $0.12), and the agent stated that the tools had no count or aggregate function. Both forks answered correctly every time.
- The newest request. Burp official answered wrongly once. Caido upstream answered correctly, but needed 8 to 17 calls and 30 to 109 KB of output to get there.
Agents are good at working around missing tools. In these runs they bisected history offsets, forged pagination cursors, and re-requested a JavaScript file from the target to read past a truncation limit. Every workaround costs turns, tokens and some reliability.
One more iteration
Burp cuts every history item at 5,000 characters, so a leaked key in the middle of a 150 KB bundle is never inside a listed message. The official server’s agent works around that by fetching the bundle again with send_http1_request. The history needs a way to find a matching spot without returning the whole document.
The fix was the same idea as the Caido snippet option. I added search_proxy_http_history. Burp’s native regex filter picks the matching items, and the tool returns each hit with its global index, a byte offset that the slice tools accept, and up to 200 characters of context on each side. It never returns a full message. The scan stops at a byte cap and a 5 second budget, so a pathological pattern returns a partial page instead of hanging the extension.
| Leaked-key task, median of 3 | Time | Tool calls | Tool output | Cost |
|---|---|---|---|---|
| Burp, official | 32.4 s | 6 | 11.9 KB | $0.17 |
| Burp, enhanced | 14.8 s | 3 | 1.1 KB | $0.09 |
Two of the three runs found the search tool on their own and answered in one or two calls. The third used the existing regex and slice tools, still answered correctly, and took 9 calls. In the scripted test the same question costs one call and 706 bytes, with the key visible in the excerpt at offset 79,810. The tables and charts in this post use 1.3.0-enhanced.2.
The replay task and my own traffic
One result went the wrong way on Caido for a different reason. Resending the captured GET /api/v1/users/7777 without its Authorization header took a median of 7 calls with my fork against 4 upstream. I recorded every tool call to find out why.
The extra calls had nothing to do with the replay itself. My fork’s tool description tells agents to use order: "desc" for the newest requests, and they did. The newest rows matching that path were the header-stripped Replay entries from earlier runs. A row showed only its id, method, URL and status, so the agent opened one to four candidates with caido_get_request to check their headers, then listed again in ascending order to reach the captured request. The upstream server avoided the problem only because it always returns the oldest row first.
The fix is small. A row now carries source whenever the request did not come through the proxy, and the tool description tells agents that source:"intercept" limits a query to captured traffic. Proxied rows are byte-identical to before.
| Replay task, median of 3 | Time | Tool calls | Tool output | Cost |
|---|---|---|---|---|
| Caido, upstream (same snapshot) | 17.5 s | 4 | 1.9 KB | $0.12 |
| Caido, forked, before the change (traced runs on a history with earlier replays) | 21.8 s | 5 | 3.5 KB | $0.13 |
Caido, forked, with source on rows (same snapshot) | 19.3 s | 4 | 2.0 KB | $0.12 |
With the change, two of the three runs still asked for the newest rows, saw that they were REPLAY, and went straight to the captured request; the third listed without an order and found it first. Tool calls are now equal. The fork’s runs took 17.4 to 20.1 s and upstream’s 16.4 to 18.6 s, so the remaining gap in wall time is inside the spread. The forks are not better at everything. They are better where the official servers lacked a primitive, and the traces showed exactly where that was.
Tool definitions have a cost too
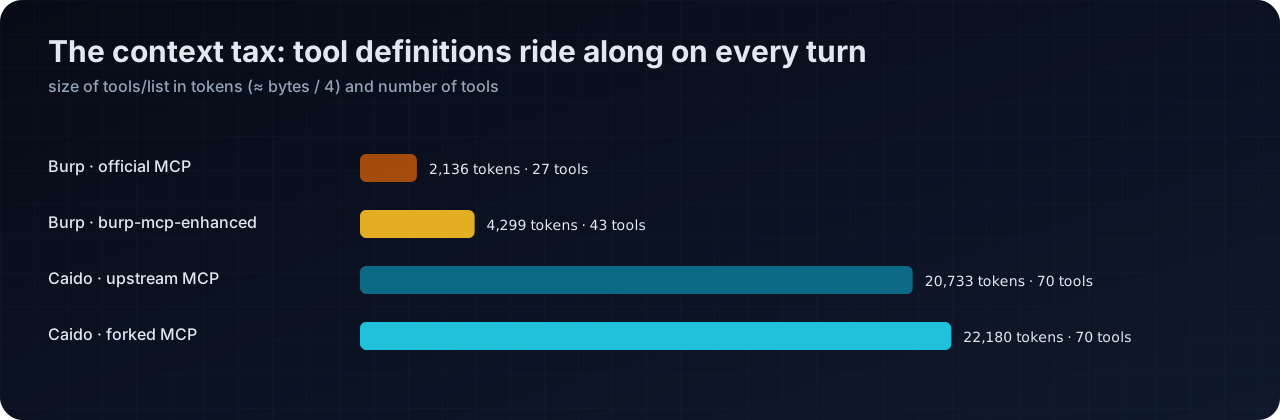
Every tool schema is sent to the model on every turn:
- Caido’s 70 tools cost about 20,700 tokens before the agent asks anything. My fork’s longer descriptions add another 1,450.
- Burp official’s 27 tools cost about 2,100 tokens, and the enhanced fork’s 43 tools about 4,300.
Prompt caching makes repeated definitions cheaper, but they still take context window. A server with fewer, sharper tools has a real advantage here, and this is the one dimension where the Burp servers clearly win.
Memory
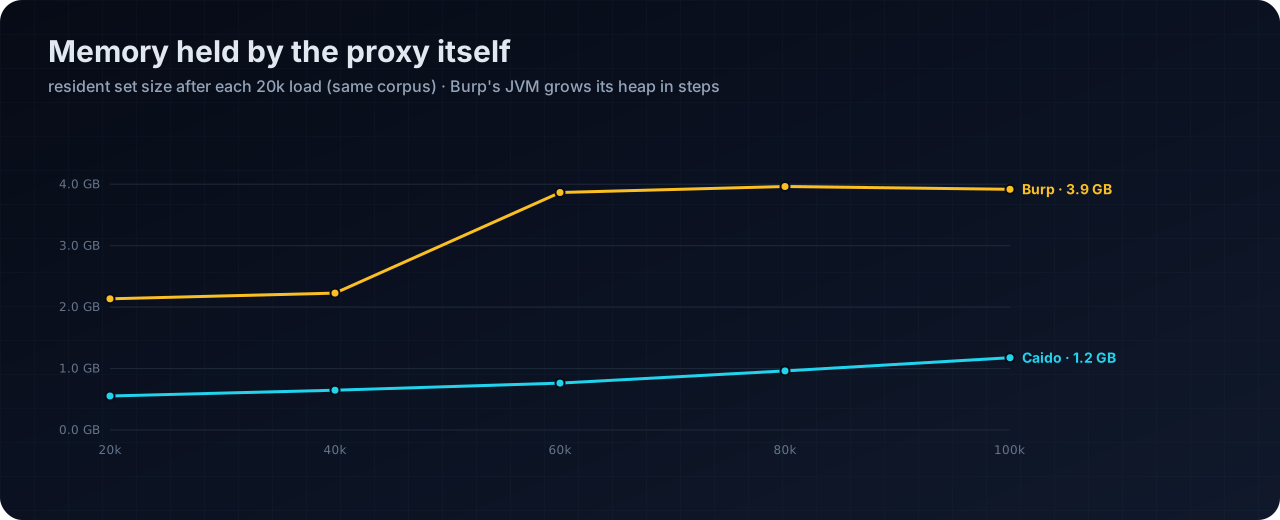
This is about the proxy itself, not the MCP server, but it matters when an agent runs for hours. Burp’s JVM grew from 2.1 GB at 20k requests to 3.9 GB at 100k with the enhanced extension, and peaked at 4.6 GB in the official-extension run. Caido grew from 0.55 GB to 1.2 GB.
What makes a proxy MCP server agent-friendly
The fixes that made the difference are not specific to Burp or Caido:
- Return totals. “How many” is the cheapest question, and it must not require listing every match.
- Let the server sort. In a live engagement the newest traffic matters most. Make newest-first one call.
- Return evidence, not documents. A regex match with an offset and 40 bytes of context answers most questions about secrets, reflections and errors.
- Keep bytes exact. Binary bodies need base64. Truncation must say so and keep the JSON valid.
- Use stable identifiers. An index that changes meaning between tools makes the agent read or replay the wrong request.
- Never block silently. An approval dialog with no timeout leaves an unattended agent waiting for a click that never comes. Fail with an error instead.
- Budget the definitions. Every tool and every sentence of its description is paid on every turn.
- Test with real agents and large histories. Ten requests hide every problem in this post. 20,000 surfaces them in minutes.
The changes to the Caido server are small: ordering and totals came to about a hundred lines, because Caido’s API already supported both. That is the main lesson for me. Most of the cost was not in the proxy or the model. It was in a thin layer of tool definitions that never exposed what the API underneath could already do.